Utilizing Pandas for Data Analysis - A Cleaner and More Convenient Way to Handle Data
Here I will be handling data using pandas functions on my Jupyter notebook. The outputs look real good in a Jupyter notebook, i could use this all day.
DATA
Ian Ng
5/15/20252 min read


Pandas for Data Analysis
Using pandas in Jupyter for data analysis gives you a clean look of your data. This is even better than excel tables.
In just a few lines of code, I'd be able to retrieve data i need within a csv file and project it within the notebook.
First, I'll need to import pandas into the notebook, then read the csv file:
Now comes the real operations within the Jupyter notebook:
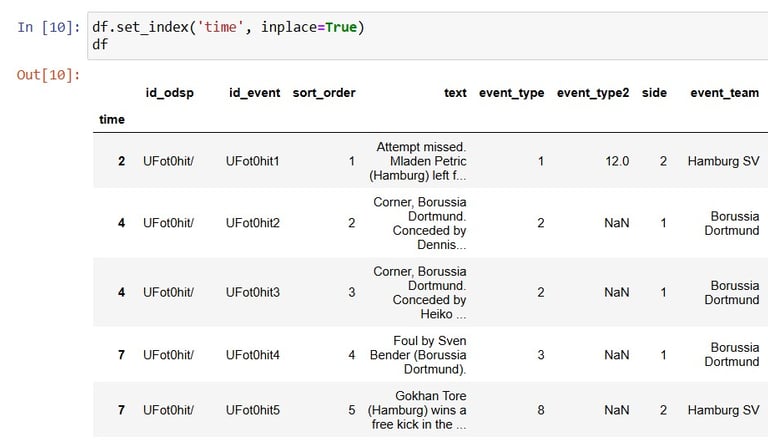
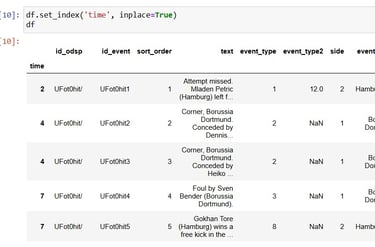
Now, if I intend to index the dataframe, here's how I'd do it:
In this table, time will be the better index for I need to know what happened in which minute of the game.
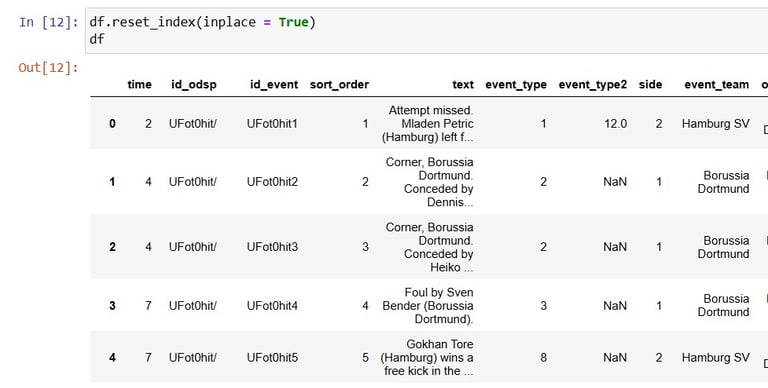
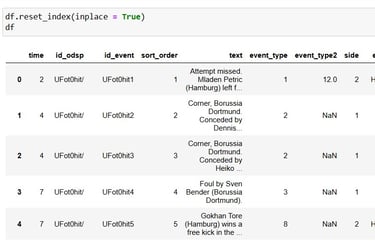
to revert the index back to the original:
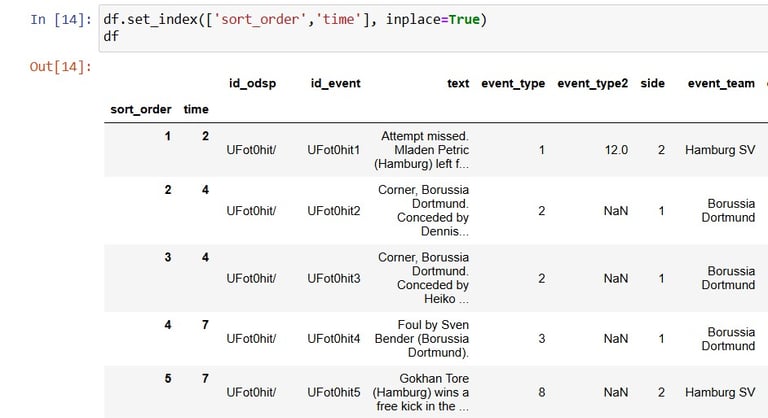
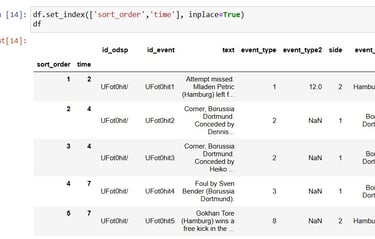
to do multi-indexing:
Now the order of the event, together with the event time became the index of this table a.k.a data frame.
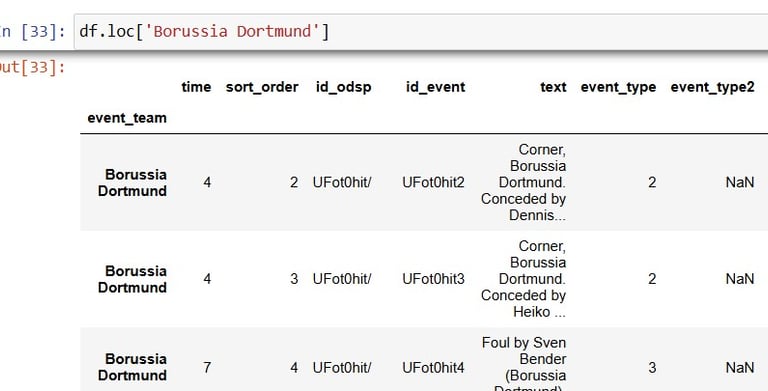
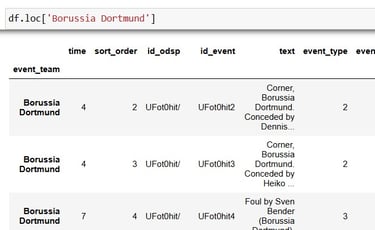
Before the next one, I am going to reset the index and do indexing on event_team.
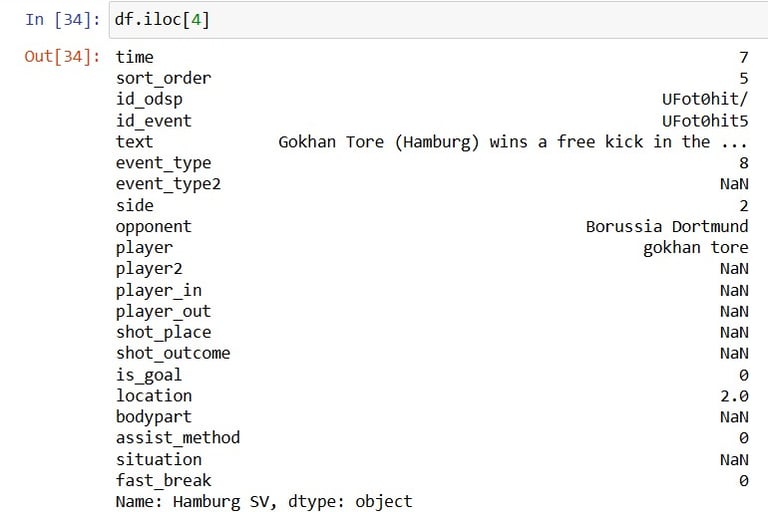
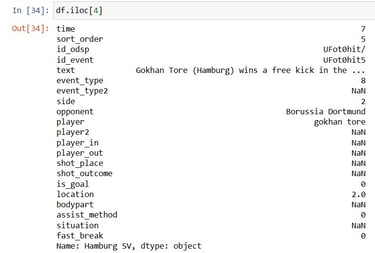
To locate the position of certain data, I could just use the loc and iloc function in pandas:
loc: searching based on labels
iloc: searching based on position
Looks like the 5th event(0 is the first position) happened in the 7th minute of the game, and went in favor of Hamburg SV.
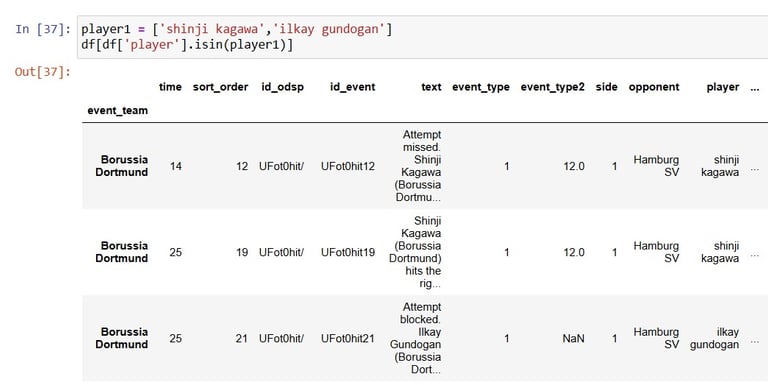
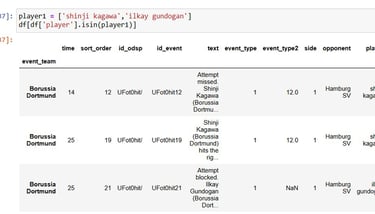
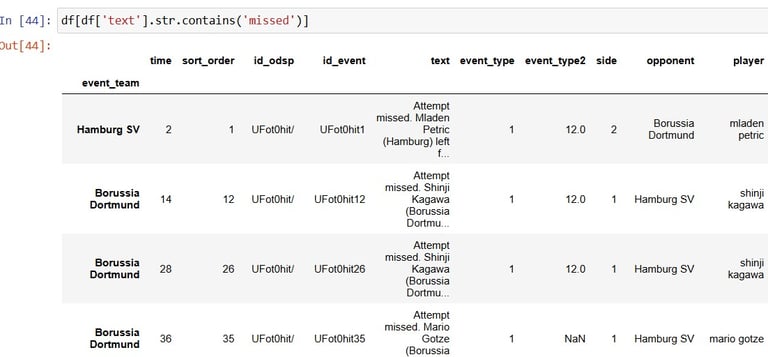
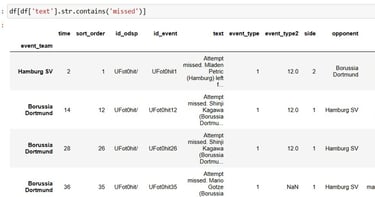
Now, to use some SQL techniques within pandas:
isin: equivalent of IN
contains: equivalent of LIKE