Excel - Pivot Table
Now, to the most basic and essential tool of all data analysis - Excel. This post shows how I'll handle data using Pivot Table in Excel
DATA
Ian Ng
7/24/20252 min read


This time we're going to look at the most basic yet essential thing in data analysis, Excel.
The quickest and most effective way to get data analysis done.
Like if any of the stakeholders you're reporting to does not want to bother with SQL or complex visualisation tools like Tableau of PowerBI, then Excel does a great job at this.
This will be a short demo on how I would use Pivot Table.
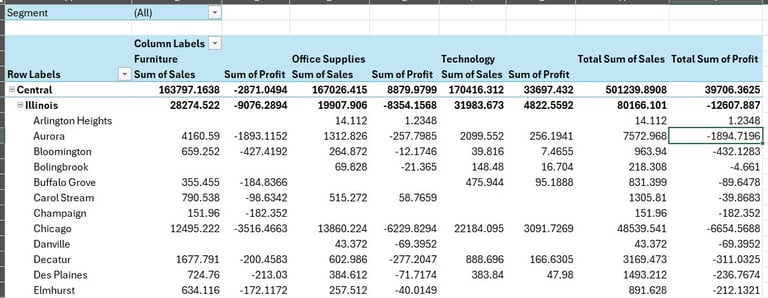
For this part I will be re-using the last CSV file, to show for each Item Category, Sales and Profit for each region, and each item category for the network of superstores, under different consumer segments:
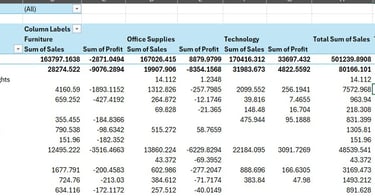
This is the end result for all segments:
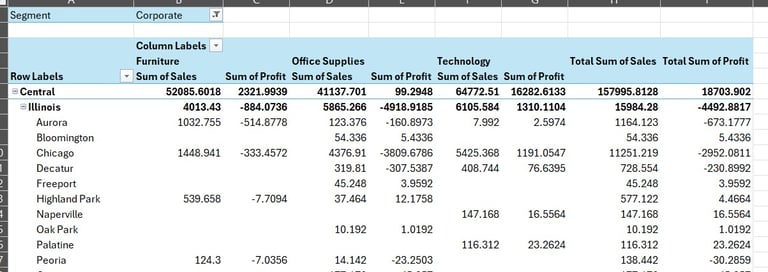
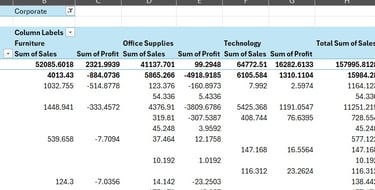
This is when it is filtered under Corporate segment:
From the Pivot Table created, you could also see that I have used regions as my rows, and further down we have the States then the final layer, the City.
This table provides an easy and quick comparison for sales and profit between cities in the same State, for example.
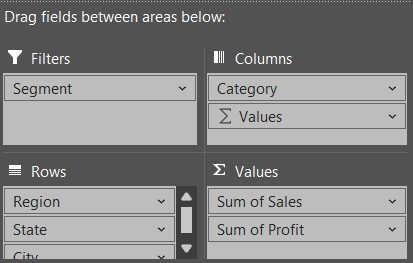
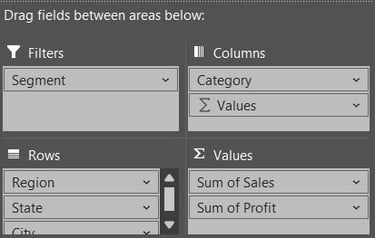
Below is how I have arranged the Pivot Table fields accordingly:
And of course, I could create calculated fields on my own to display more meaningful data based on needs. But this is how I am using Pivot Tables to handle data in a more structured way in Excel.